Everything you need to know about your business — in one dashboard.
From the counter to management: TicasBoard reads your sales in ZoneSoft and gives them back as clear analytics. No spreadsheets, no manual work, no IT team required.
Your business day, at a glance.
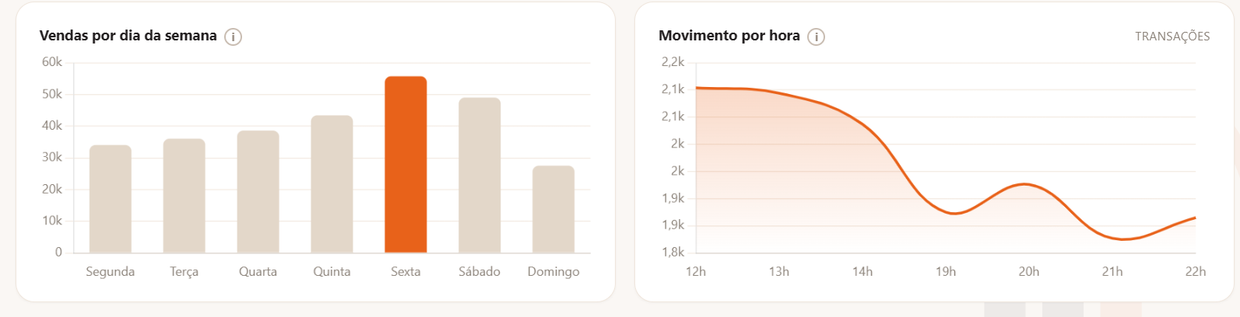
Revenue, average ticket, number of transactions and cash days right at the top. Below, the month-by-month evolution with a trend line, sales by weekday and traffic by hour.
- Sales by day and by hour — spot your peak hours
- Comparison with the same period last year
- By store or aggregated for the group
Where the money in your business is.
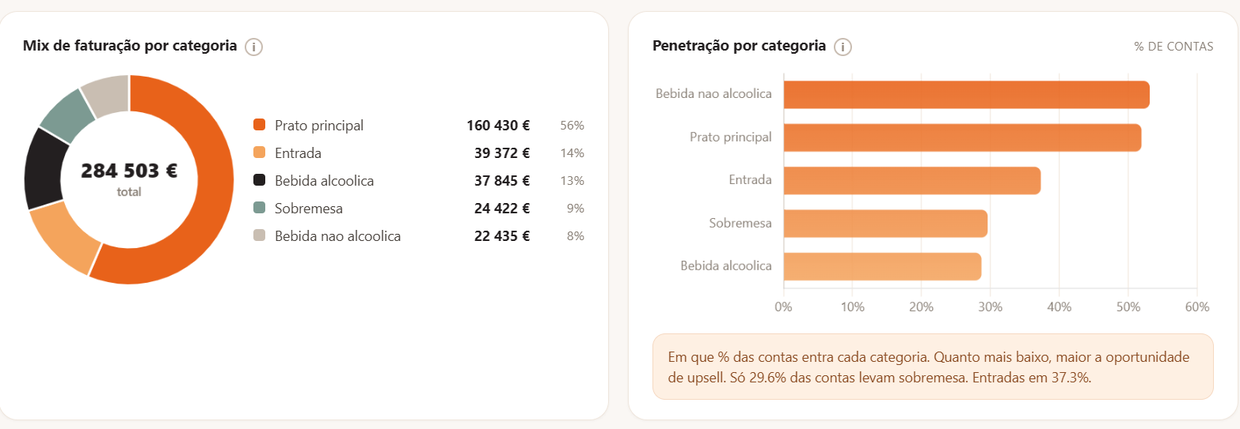
Revenue mix by category, penetration per check (in what % of checks each category appears) and the top items and families. Understand what sells, what to push and where there's upsell opportunity.
- Top items and families by revenue
- Penetration by category — upsell opportunities
- Sales mix by analysis category
Stars, Plowhorses, Puzzles and Dogs.
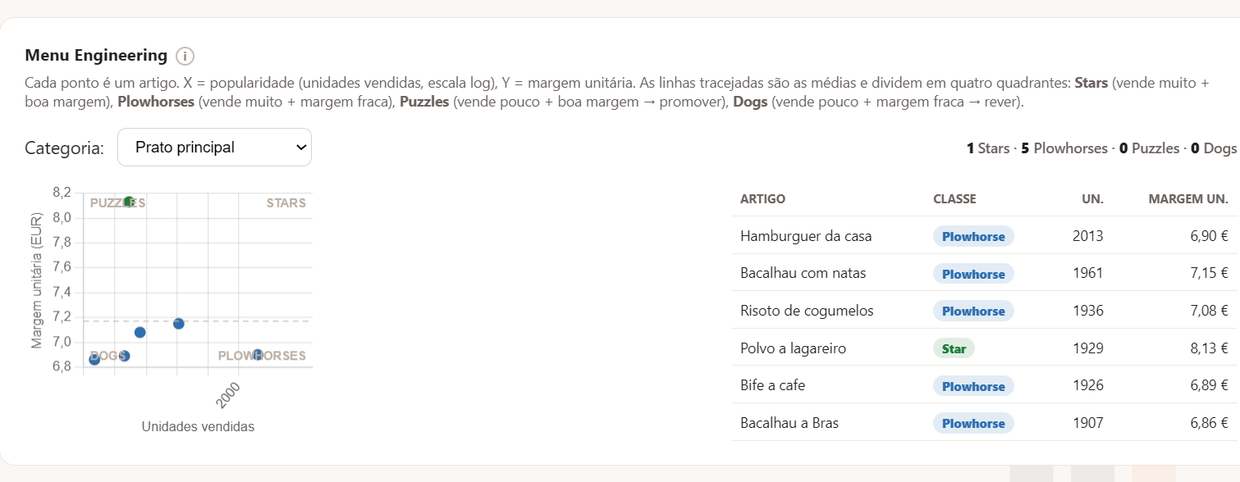
Every item placed by popularity and margin. See at a glance what's a star (sells a lot and brings margin), what needs rethinking and what's worth promoting.
- Clear quadrants by margin and popularity
- Unit margin per item
- Filter by analysis category
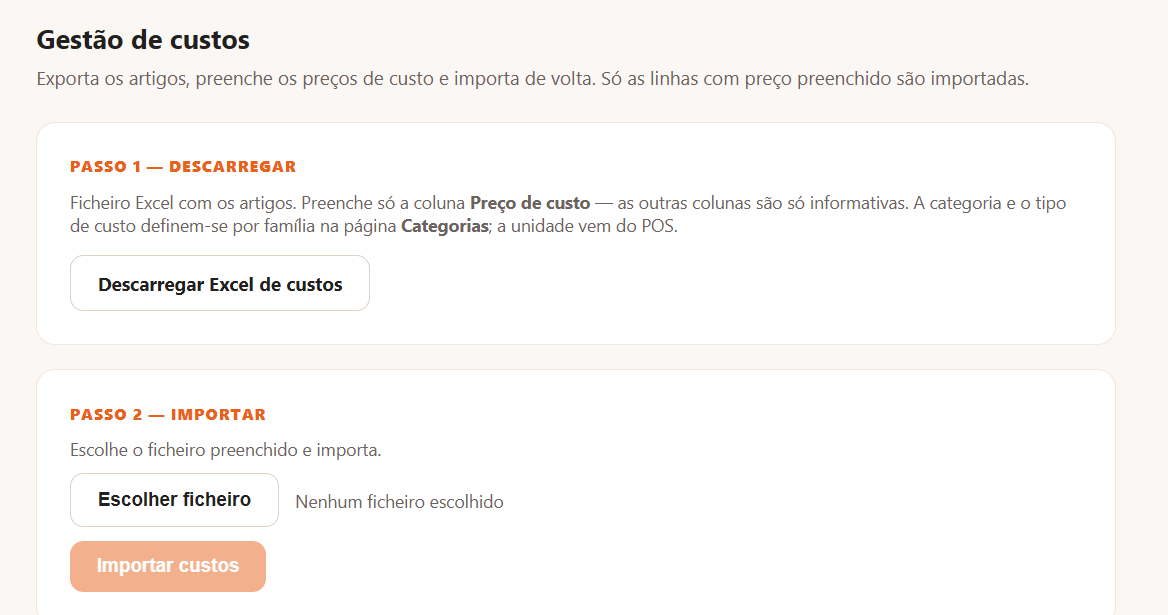
Real margins, without entering purchases in the POS.
Most businesses don't enter purchases in the point of sale — and without cost there's no margin. TicasBoard solves this two ways: connect your PHC and costs come in on their own, or export an Excel, fill in the cost prices and import it back. From there you get food cost, beverage cost and margin by category.
- PHC connection — automatic costs
- Excel import — at your own pace
- Food cost, beverage cost and margin by category
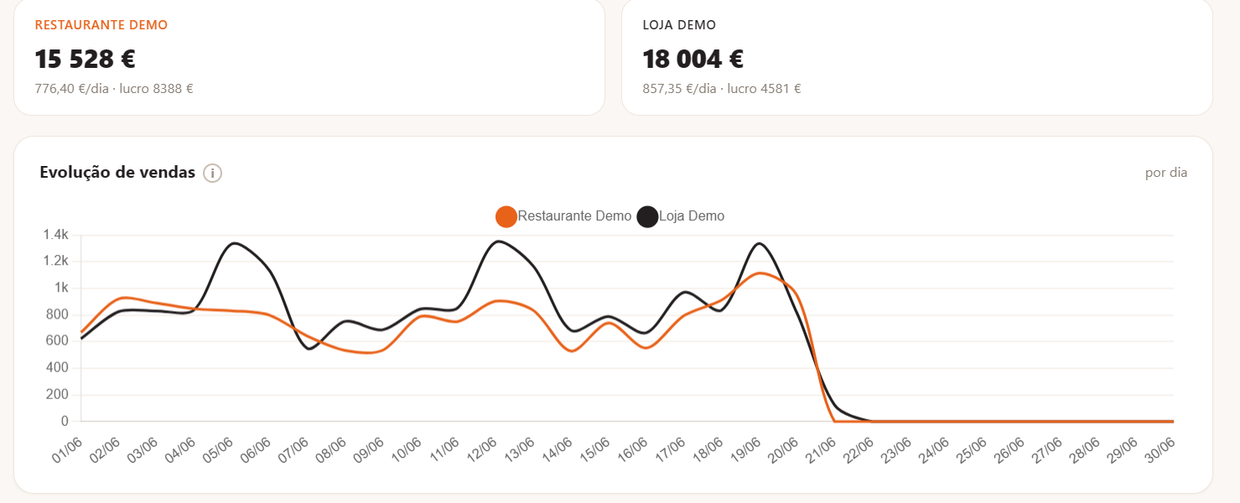
Compare your stores side by side.
Have more than one store? See them on the same chart — sales and profit of each, day by day. Spot the one pulling the group up and the one that needs attention.
- Several stores on the same chart
- Sales and profit per store
- Aggregate the group or drill into each store
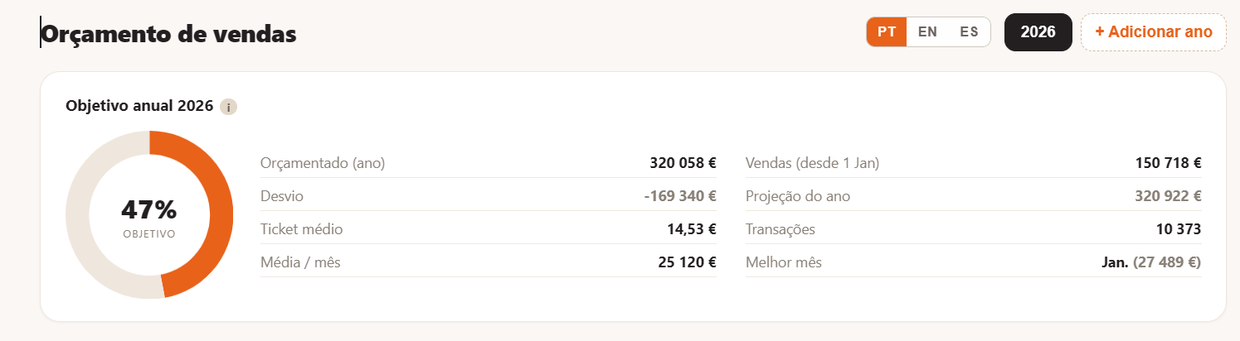
See the year before it happens.
Set the sales budget and track how it's met month by month, with the year's forecast and deviation. Drill down to the day and the receipt to see exactly where you win — and where you fall short.
- Annual target and year forecast
- Deviation by month, by day and by receipt
- Real profit when costs are loaded
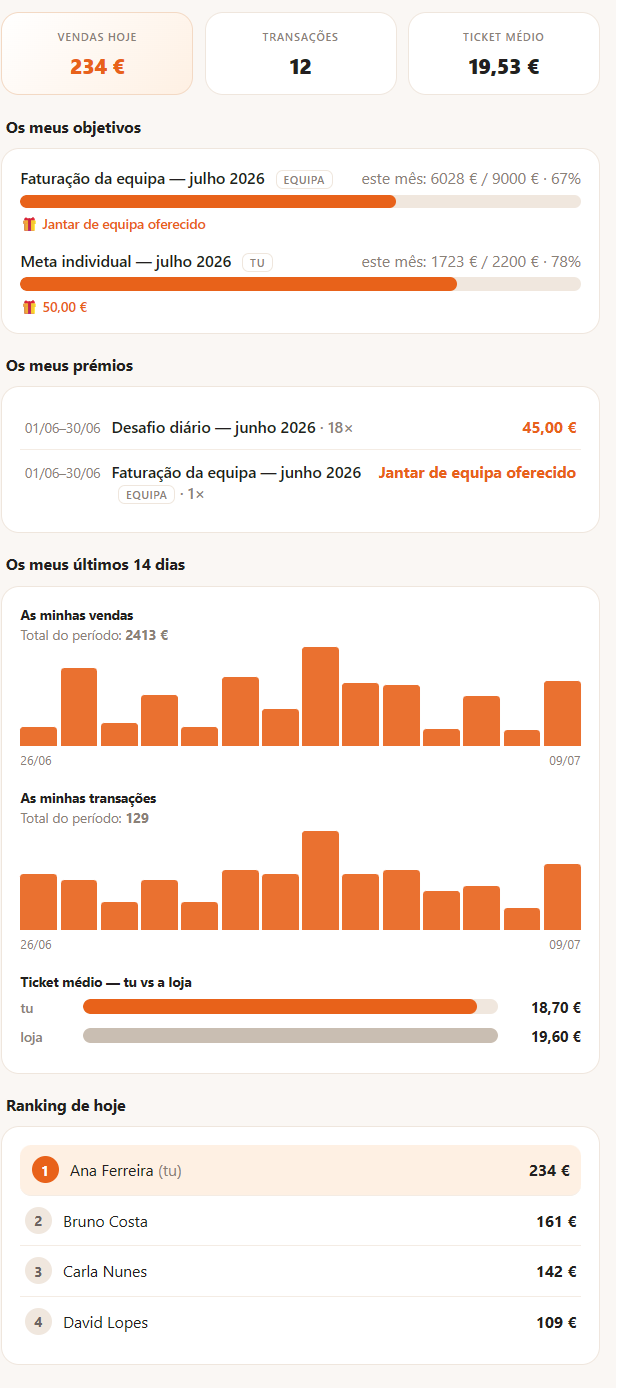
Goals and rewards that drive your team.
TicasBoard turns sales into clear goals for your team — individual or group — each with its own reward. Every team member has personal PIN access and sees, on their phone, today's progress, the store ranking and the rewards they've already earned. At month-end, rewards are calculated automatically for the manager to approve.
- Individual and team goals, with daily, weekly or monthly targets
- Cash or in-kind rewards, settled at month-end
- Staff app with PIN — progress, ranking and rewards in real time
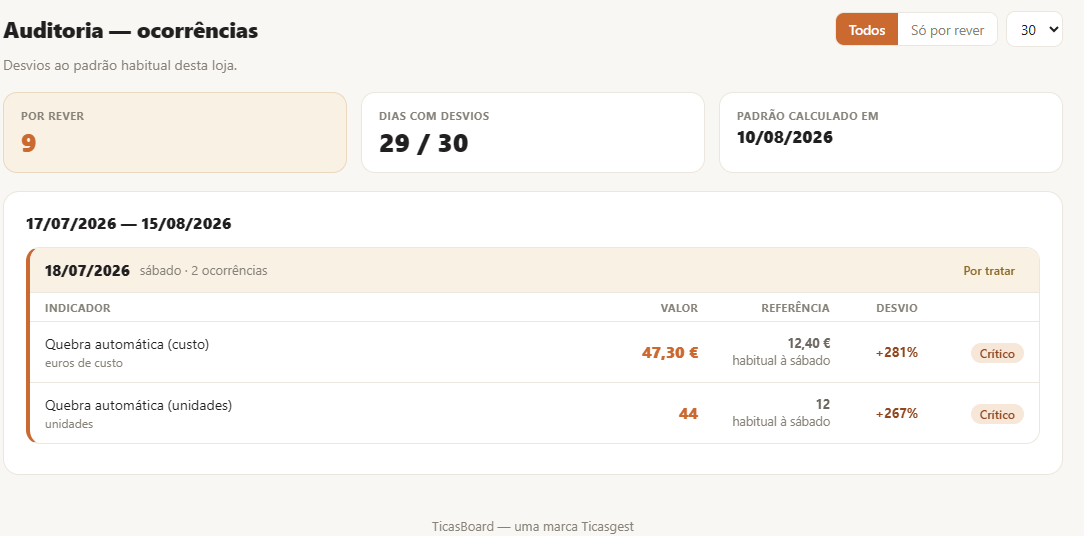
See what departs from the usual and get alerted in time.
Voids, waste, comps and discounts read against the store's own pattern. When something departs from normal, TicasBoard flags it and alerts you by email. Included in the plan.
And there's more
More things that make your life easier.
Automatic email reports
Choose the reports and the frequency — daily, weekly or monthly — and get them on their own in your inbox, at the time you set. No need to open the dashboard.
Team incentives
Goals, rankings and per-shift bonuses, right at the point of sale. Turn targets into results, in restaurants and retail.
Heatmaps
Cross weekday, hour, table or family with any metric and find the most and least profitable moments to act on.
On any screen, in 3 languages
Computer, tablet or phone. Interface in Portuguese, English and Spanish, with data always in Europe (GDPR).
FAQ
How it works, in detail.
How does TicasBoard get my sales data?
It connects to ZoneSoft and automatically reads sales, products and operators, syncing throughout the day. You don't have to export anything.
Can I see several stores at once?
Yes. View each store or the group as a whole, and compare stores side by side on the same chart.
What is Menu Engineering?
It's the analysis that places each item by popularity and margin (stars, plowhorses, puzzles and dogs), so you know what to promote, rethink or keep.
Do I need to install anything?
No. It's a web app: open it on your computer, tablet or phone, with no installation, in Portuguese, English or Spanish.
How do team incentives work?
Create individual or team goals with rewards; each employee signs in by PIN and sees their progress, the ranking and rewards on their phone. At month-end, rewards are calculated for the manager to approve.
How often is the data updated?
It syncs automatically throughout the day, so the dashboard reflects recent sales with no manual work.
Want to see this with your own data?
Book a demo and we'll show you the dashboard in action, no commitment.